Initial Distribution Transformer Analysis
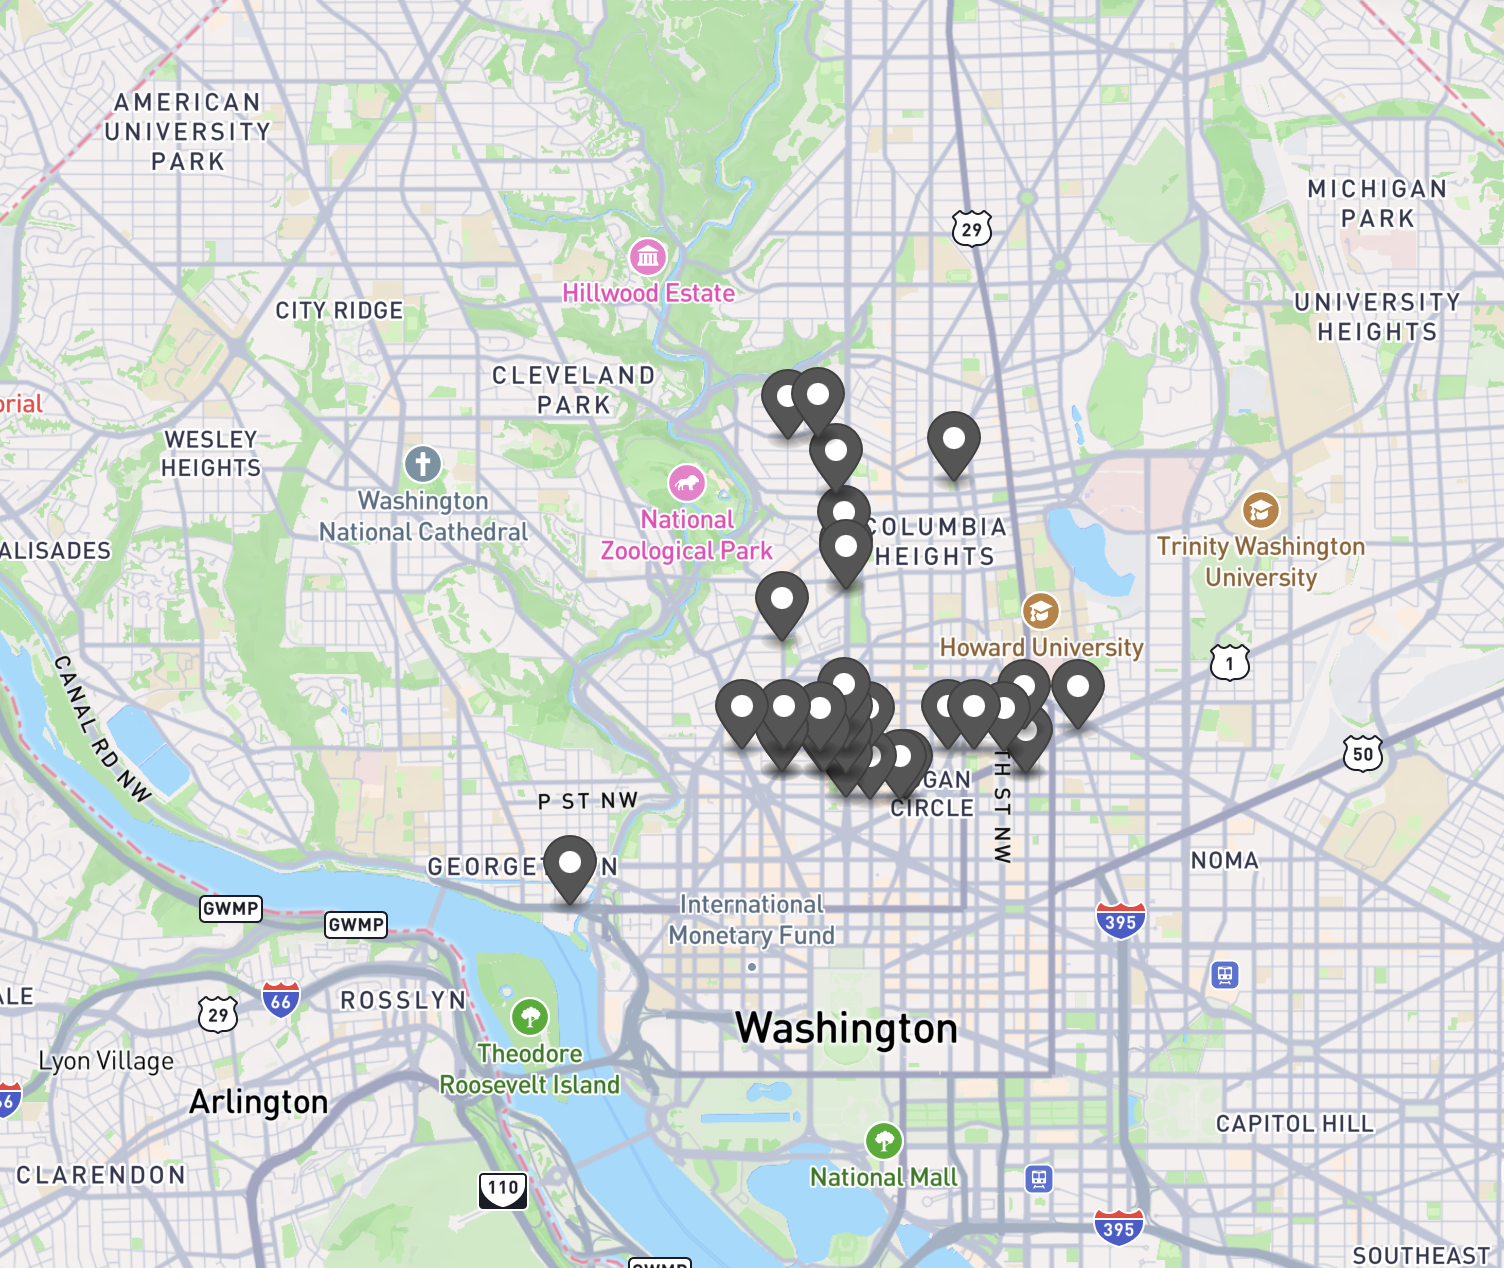
We have analyzed the acoustic signatures of 34 distribution transformers across DC, and are excited to get more recordings at more times from more transformers soon.
But for now, let's dig into what we've found.
What Are We Looking For?
While there are many different ways that a transformer can produce noise, we are looking to track specifically the phenomenon of magnetostriction and its harmonics. This means we want to take an audio recording of transformer and look for 120 Hz.
Here's an example recording, taken from the transformer at 17th and R St NW on June 23, 2025 at about 3pm:
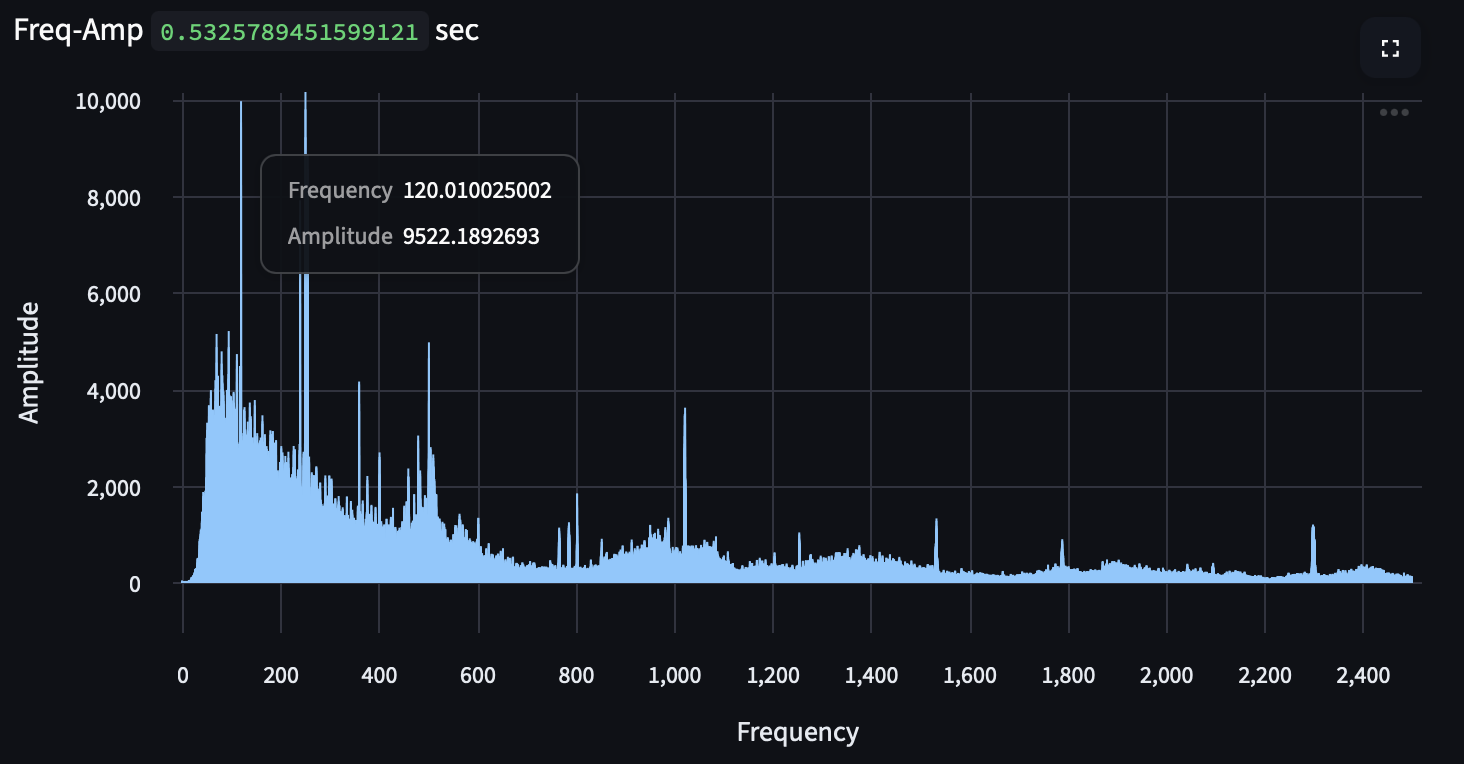
This includes the traffic on the street, me being unsteady with my hand, and the cooling fans that are internal to the transformer. With the recording in this form, it's tough to really get anything useful out of it. But we can use a Fourier transform to see what the individual frequencies are that make up the sound we're listening to:
While we could look at this up to 25,000 Hz, the only interesting stuff happens at the lower end of the frequencies (< 2,500 Hz), and there ends up being too much data for my poor little computer to support visualizing with 2.5M datapoints.
This Fourier transform is designed to show us every 1/100 Hz, which allows us to be very precise with our measurements, which is how we can see the first bit of information we're looking for: is there a 120 Hz tone? How precisely 120 Hz is it? We can see that it's ringing loud and clear at 120.01 Hz, which is great! This is definitely an active transformer, and we can hear the first physical phenomena that we're looking for. In addition, it's highlighting a lot of other tonals that are not what we're expecting — the harmonics are expected, but more research needs to be done to deduce the sources of the other tones.
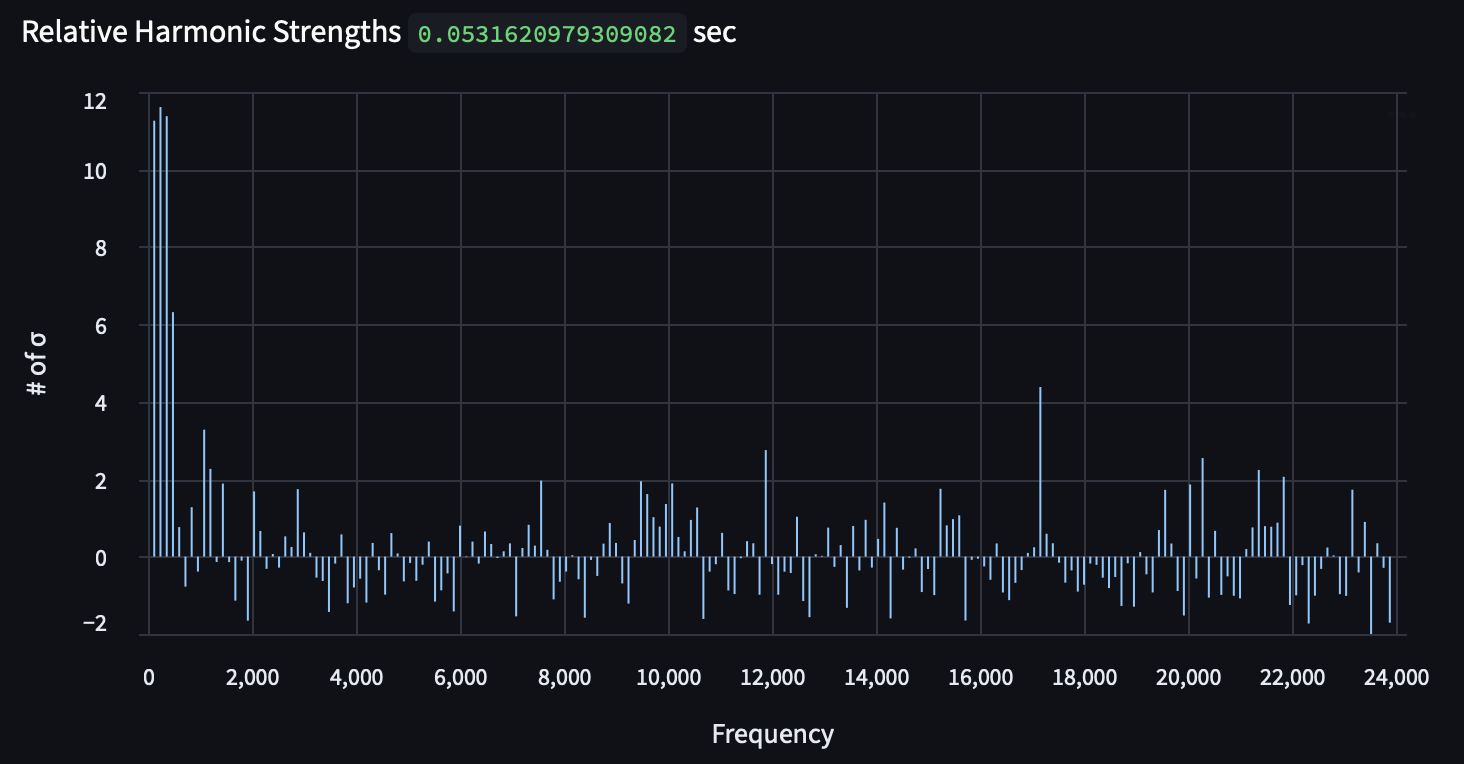
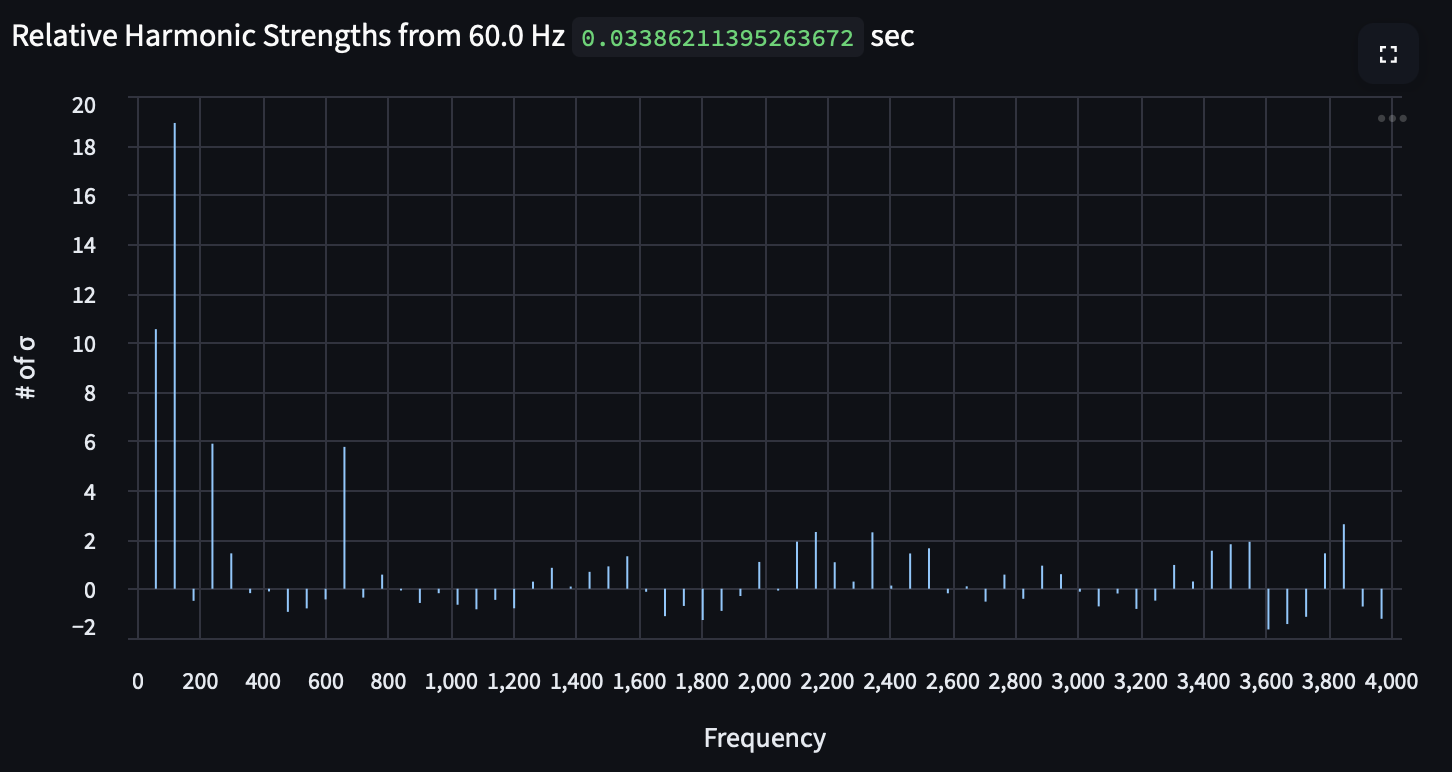
Now, let's dig into the harmonics: in order to make sense of them, we really want to see how loud they are relative to the surrounding noise. Let's calculate that relative power for each harmonic: given a local bandwidth of 240 Hz, what is the standard deviation of the noise, and how many standard deviations above the mean is the calculated harmonic?
Alright! We like the strong fundamental through 3rd harmonic, but really just as an identifying feature of a transformer. It means there's a slight amount of distortion in the electricity, which is to be expected from the changing nature of the loads on that block (bars, restaurants, and the grocery store I primarily use).
What Are We Not Looking For?
Great, we've seen a transformer, but what does literally anything else look like? I find the relative harmonic graph to be the most useful for categorizing a transformer, so let's look at those for some not-transformers.
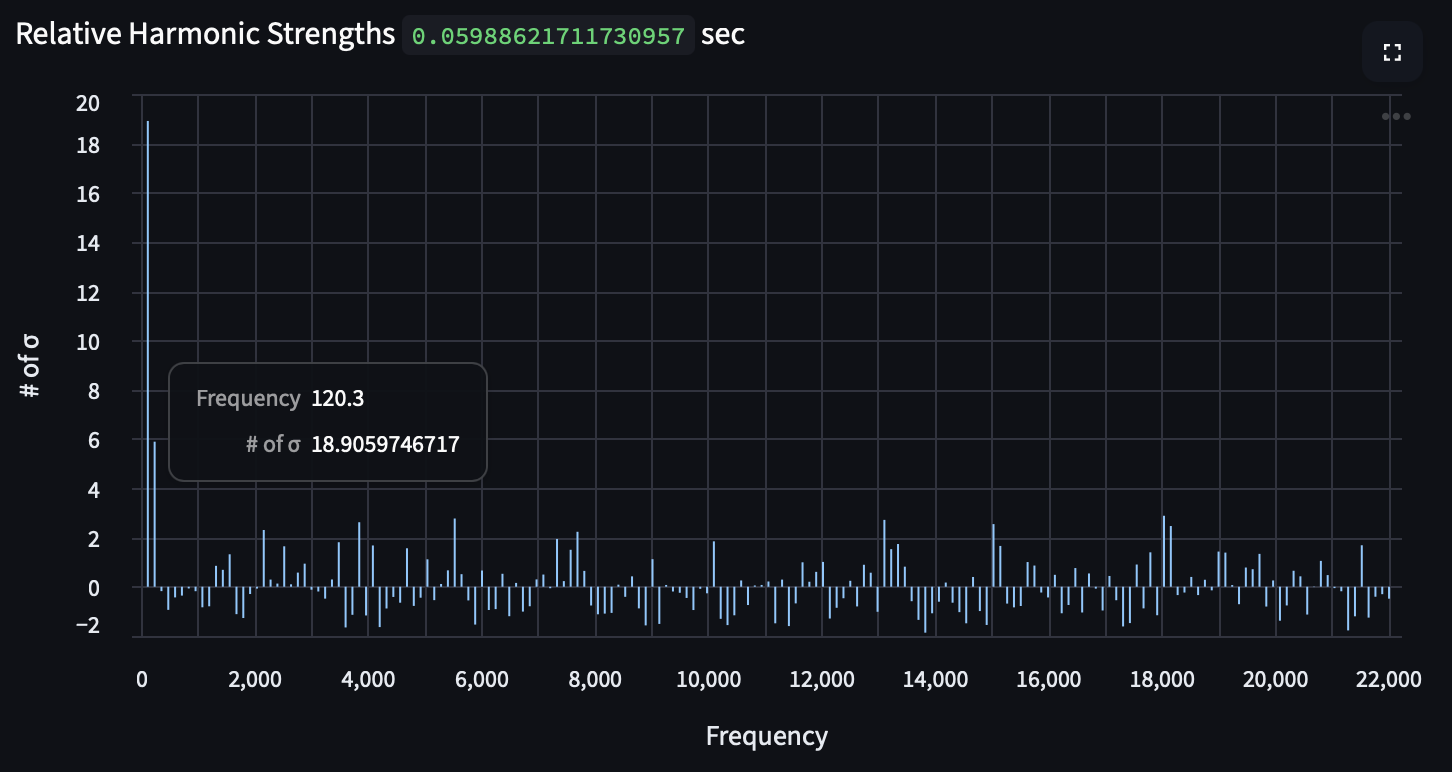
Here's some song I was listening to, as recorded by small microphone with a 44.1 kHz sampling rate on a Raspberry Pi (this is our standard recording device that we'll be using in the future).
While it's got something close to 120 Hz, the 120.3 Hz is very much out of specification for the electric grid, so we can be confident that what we're listening to is either an imminent blackout or simply not a transformer (this one is an Indigo de Souza song). In addition, we can see that we really only get that fundamental frequency and no real harmonic — a sign that the 120.3 Hz isn't a fundamental frequency of something, but rather is itself a harmonic.
In fact, the 120.3 Hz tone is the 2nd harmonic of the fundamental 60.15 Hz tone, which is noise from the recording circuitry itself. This is good to know for any future recordings we use it for, and it may be worth building a different recording device that doesn't pick up its own electrical noise.
Here are the 60 Hz harmonics from the Raspberry Pi recording device:
Overall Harmonic Assessment
So what do the 34 transformers look like as a group? This is tough to answer, because we don't have a single metric yet that classifies a transformer as "heavily distorted" yet —

