
Initial Distribution Transformer Analysis
We have analyzed the acoustic signatures of 40 distribution transformers across DC, and are excited to get more recordings at more times from more transformers soon.
But for now, let's dig into what we've found.
What Are We Looking For?
Physically
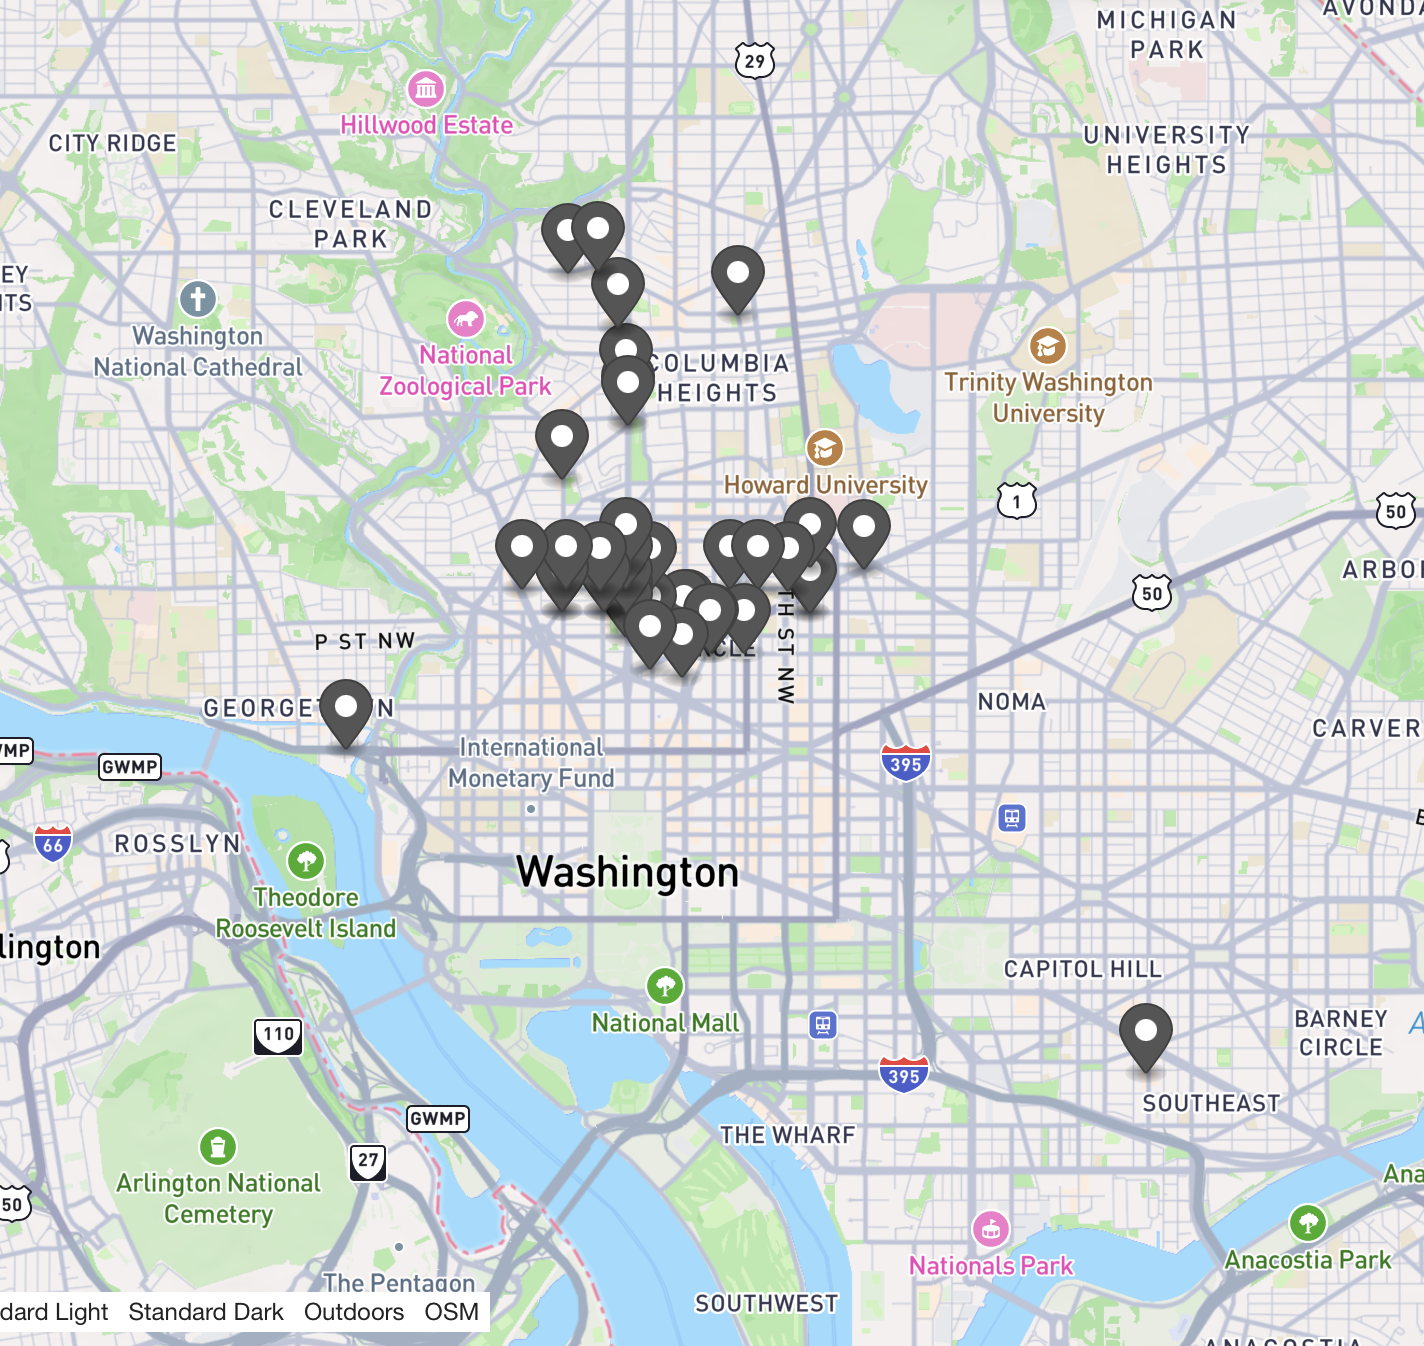
We're looking for transformers, which are in gray boxes on almost every other block in DC. Our research has shown us that sometimes the gray boxes are active, and sometimes they're not. And in the beginning, I didn't know which gray boxes to look for, but I've luckily narrowed it down a bit and can reliably identify them, although some of them don't appear to be operating.
Acoustically
While there are many different ways that a transformer can produce noise, we are looking to track specifically the phenomenon of magnetostriction and its harmonics. This means we want to take an audio recording of transformer and look for 120 Hz.
The current recordings include the traffic on the street, unsteady hands, and the cooling fans that are internal to the transformer. We are currently in the process of building recording devices that will allow us to affix the device to the transformer and maintain a constant, unwavering distance. Street traffic is variable and thus will not affect our analysis. Transformer fans are part of the transformer, and therefore are desired for our analysis.
Our goal is to record 100 transformers, twice a day (5-6pm and 3-4am), for an hour each time. This consistent recording will allow us to assess the peak and nadir for each transformer and evaluate the impact of the loads on the transformer and each transformer's capacity to deal with their loading.
Here's an example recording, taken from the transformer at 17th and R St NW on June 23, 2025 at about 3pm:
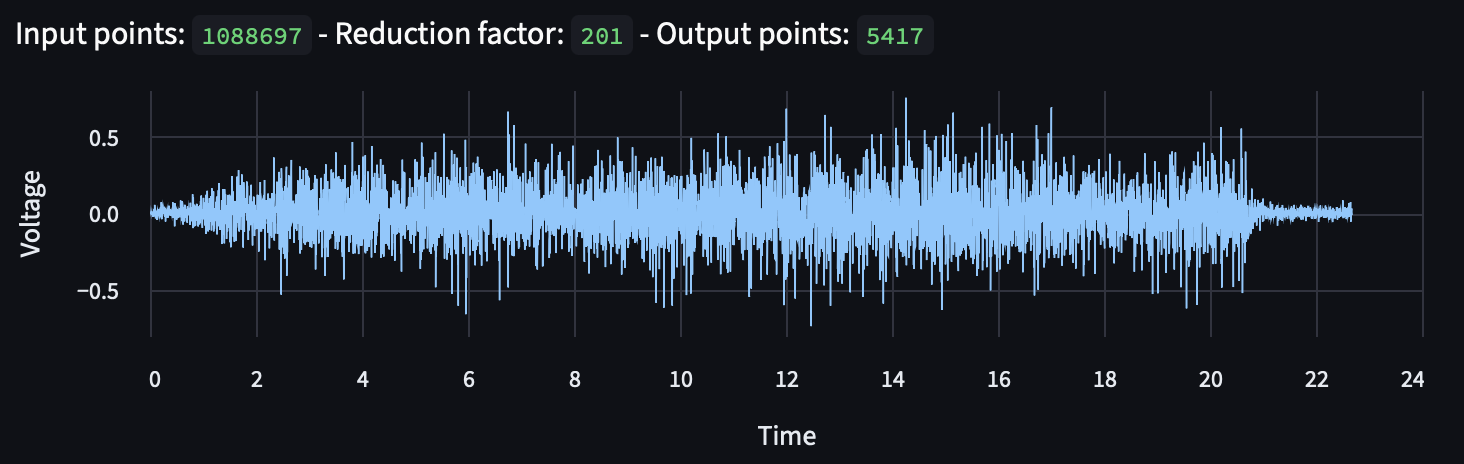
With the recording in this form, it's tough to really get anything useful out of it. But we can use a Fourier transform to see what the individual frequencies are that make up the sound we're listening to:
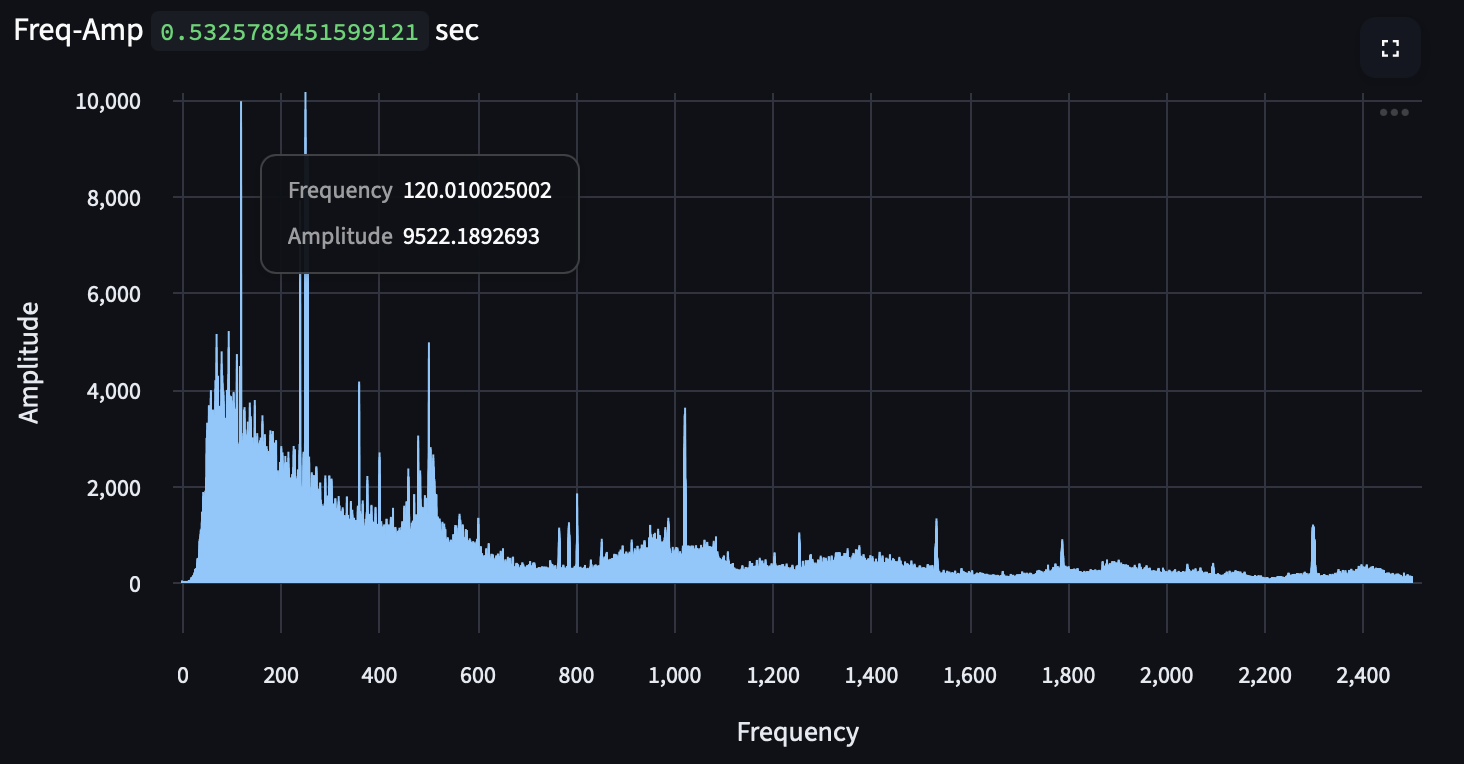
While we could look at this up to 25,000 Hz, the only interesting stuff happens at the lower end of the frequencies (< 2,500 Hz), and there ends up being too much data for my poor little computer to support visualizing with 2.5M datapoints.
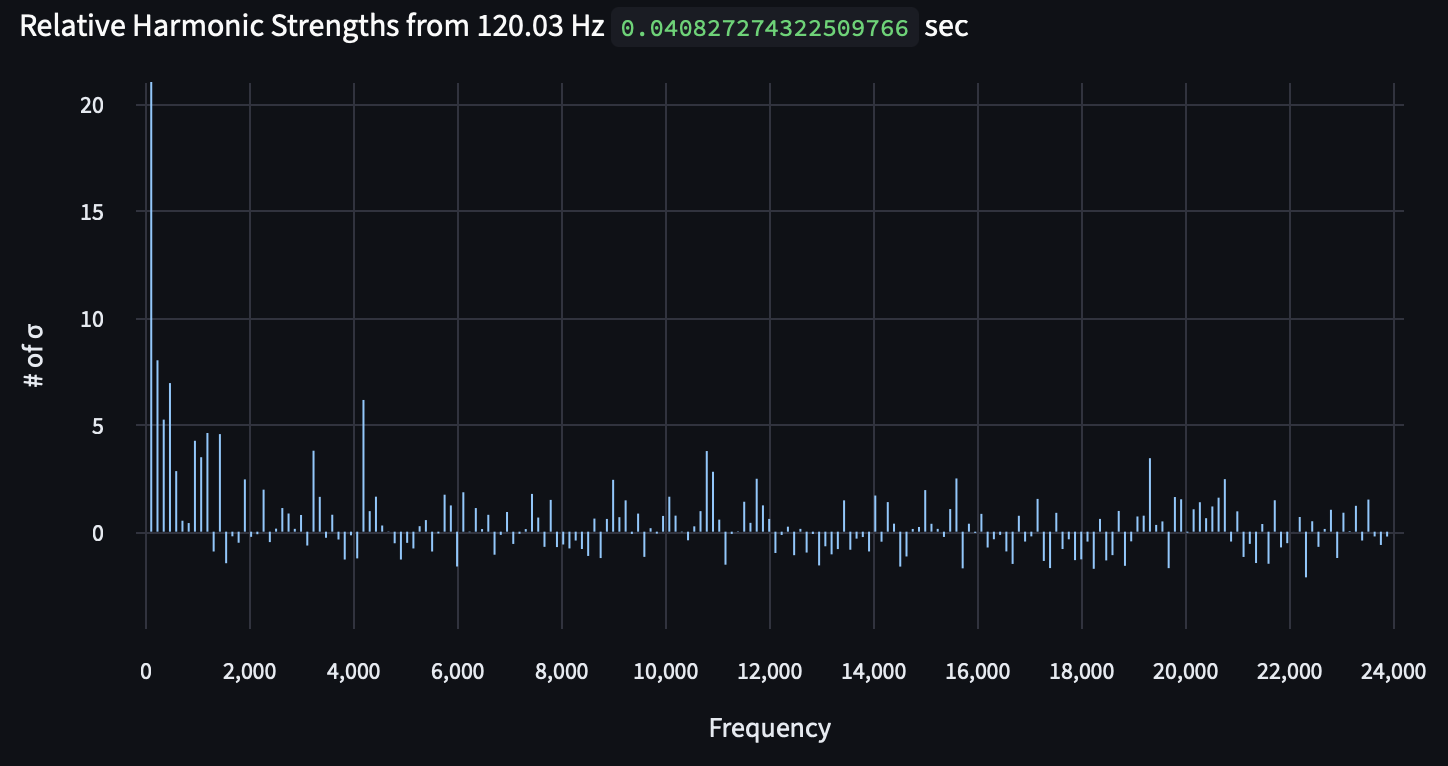
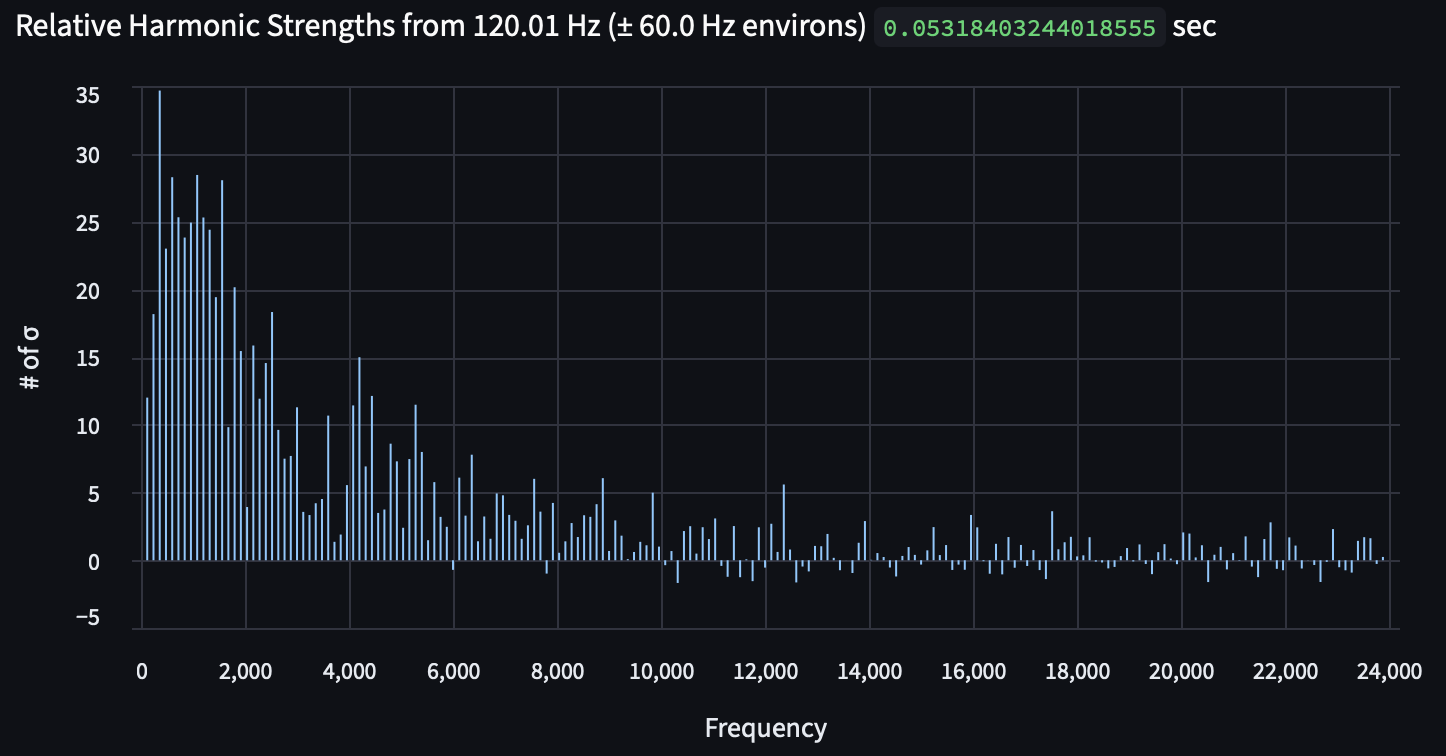
This Fourier transform is designed to show us every 1/100 Hz, which allows us to be very precise with our measurements, which is how we can see the first bit of information we're looking for: is there a 120 Hz tone? How precisely 120 Hz is it? We can see that it's ringing loud and clear at 120.01 Hz, which is great! This is definitely an active transformer, and we can hear the first physical phenomena that we're looking for. In addition, it's highlighting a lot of other tonals that are not what we're expecting — the harmonics are expected, but more research needs to be done to deduce the sources of the other tones.
Now, let's dig into the harmonics: in order to make sense of them, we really want to see how loud they are relative to the surrounding noise. We do this by limiting our view to a bandwidth of 240 Hz (the span between two harmonics) surrounding a given harmonic and calculating the mean and standard deviation of the area. Then, we can look at the amplitude of the harmonic and assess how unexpected it would be to get that value given binomial random distribution.
Let's calculate that relative power for each harmonic: given a local bandwidth of 240 Hz, what isare the mean and standard deviation of the noise, and how many standard deviations above the mean is the calculated harmonic?
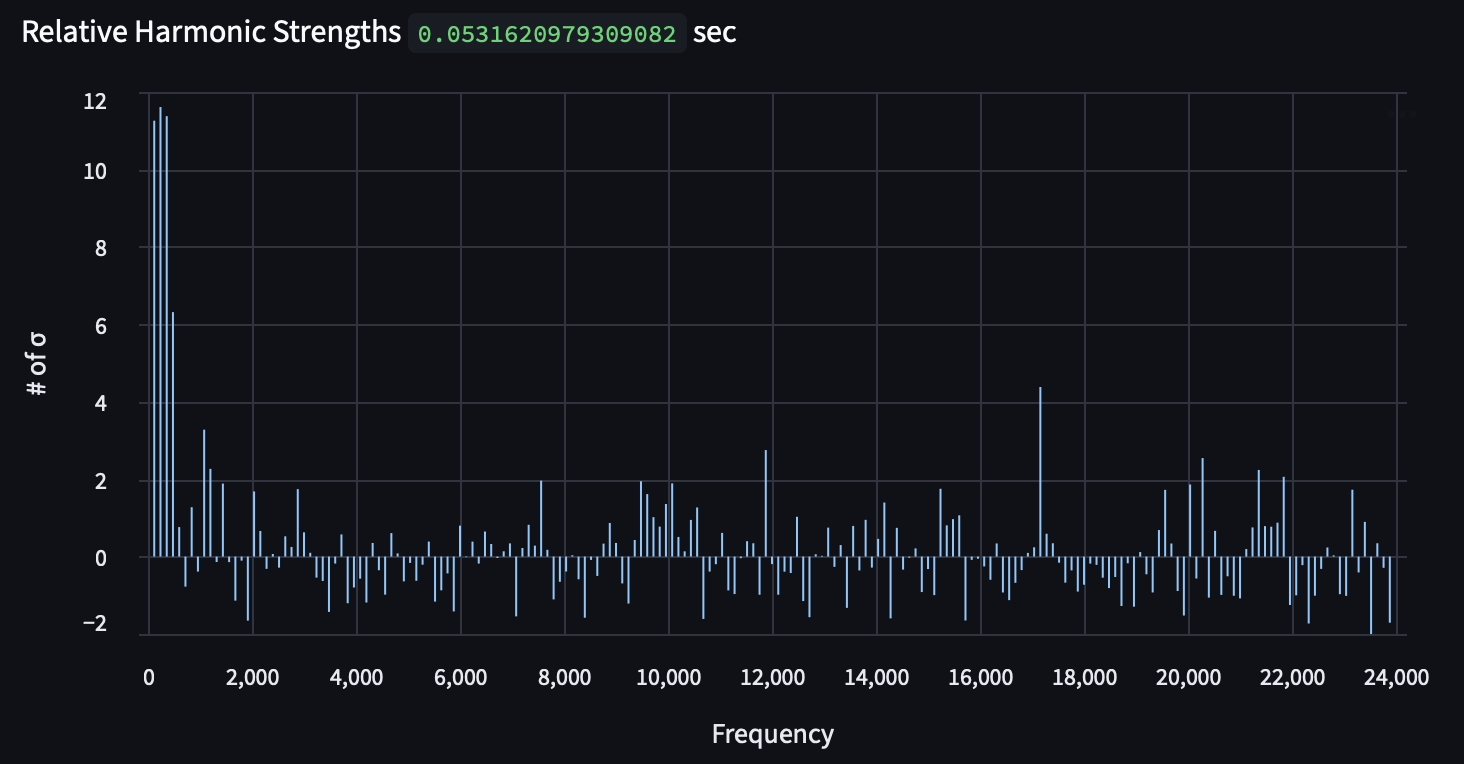
Alright! We like the strong fundamental through the next 3 harmonics, but really just as an identifying feature of a transformer. It means there's a slight amount of distortion in the electricity, which is to be expected from the changing nature of the loads on that block (bars, restaurants, and the grocery store I primarily use). We are unable to extract particularly meaningful information from those harmonics alone.
What Are We Not Looking For?
Great, we've seen a transformer, but what does literally anything else look like? I find the relative harmonic graph to be the most useful for categorizing a transformer, so let's look at those for some not-transformers.
Here's some song I was listening to, as recorded by small microphone with a 44.1 kHz sampling rate on a Raspberry Pi (this is our standard recording device that we'll be using in the future).

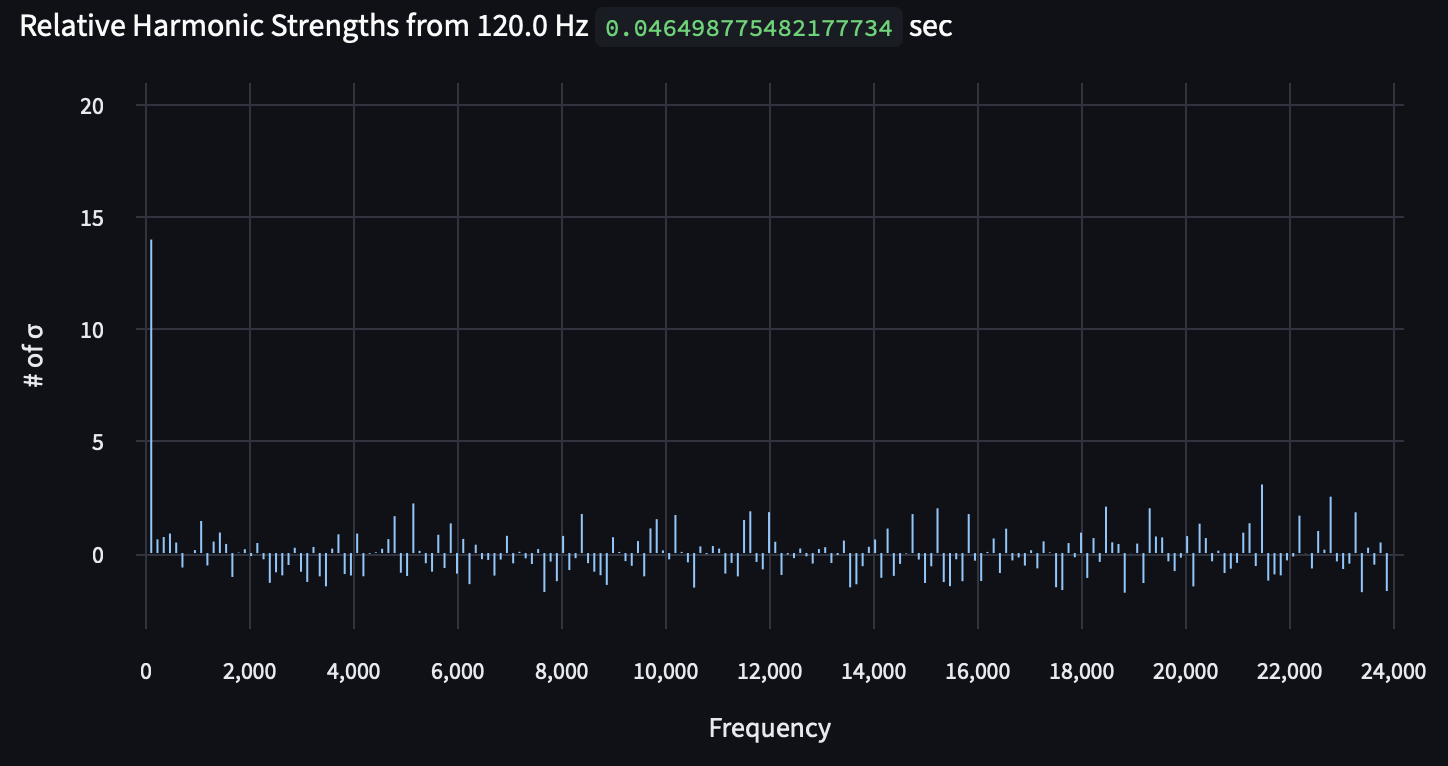
While it's got something close to 120 Hz, the 120.3 Hz is very much out of specification for the electric grid, so we can be confident that what we're listening to is either an imminent blackout or simply not a transformer (in this case, it's an Indigo de Souza song). In addition, we can see that we really only get that fundamental frequency and no real harmonics — a sign that the 120.3 Hz isn't a fundamental frequency of something, but rather is itself potentially a harmonic.
In fact, the 120.3 Hz tone is the 2nd harmonic of the fundamental 60.15 Hz tone, which is noise from the recording circuitry itself. This is good to know for any future recordings we use it for, and it may be worth building a different recording device that doesn't pick up its own electrical noise.
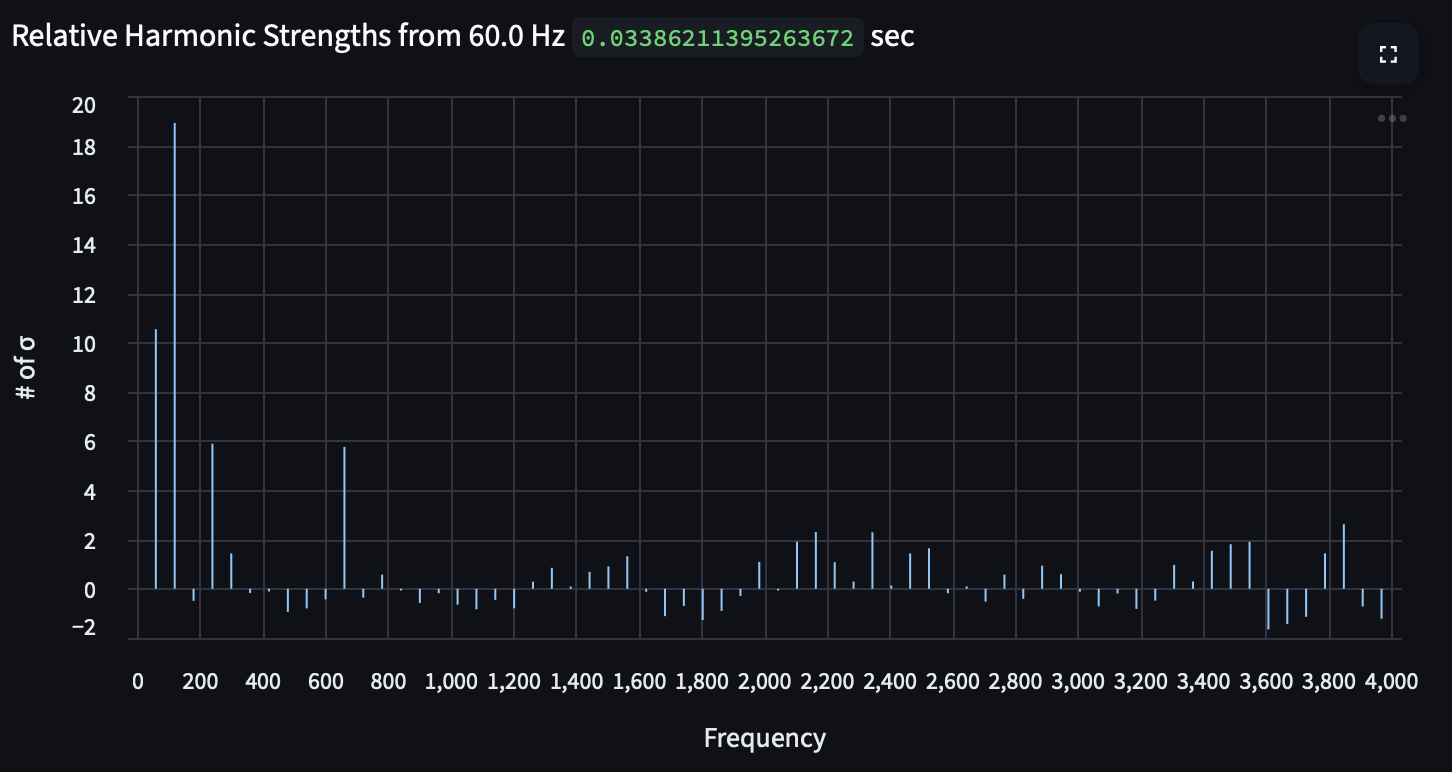
Here are the 60 Hz harmonics from the Raspberry Pi recording device:
Tonal Assessment
So what do the 40 transformers look like as a group?
120 Hz Tonal
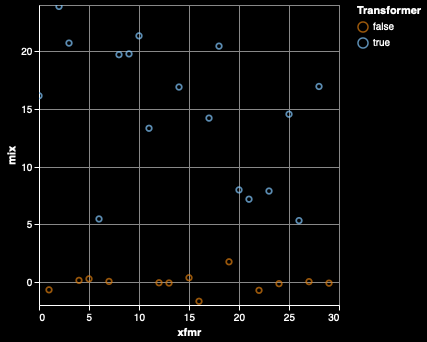
I implemented a naïve homing algorithm to find the most likely 120 Hz tone (since it isn't guaranteed to be precisely 120.00 Hz), which is the first and best method of examining whether something is a transformer or not and whether it's operating or not.
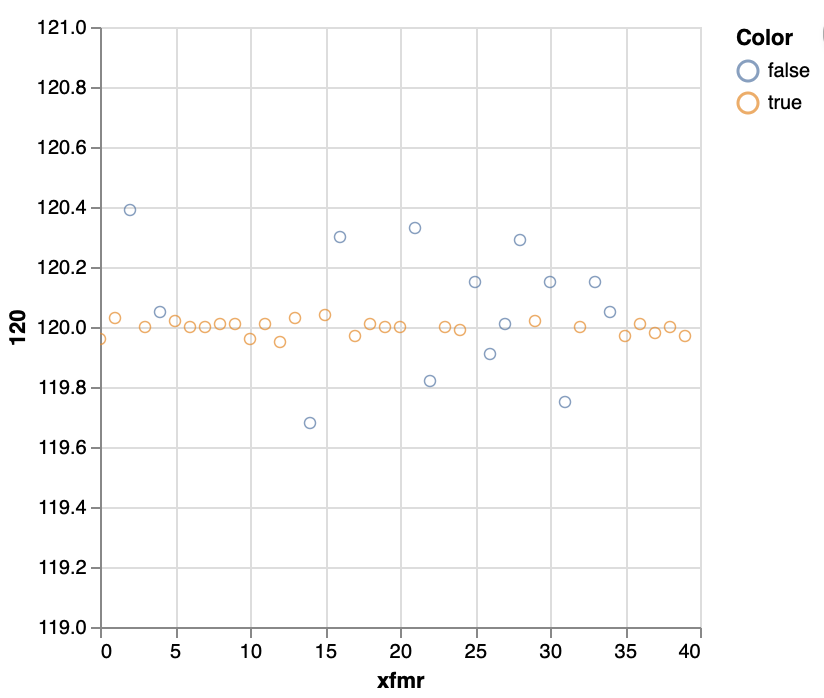
The orange dots mark those that are not operating transformers, whereas the blue dots mark those that are. As you can see, the frequency maintenance is pretty good, and that the transformers are well operated and pretty close to their target of 120 Hz. There's noise in everything — if you're looking for 120 Hz, you'll find it — so when the homed-in 120 Hz tone deviates by more than a couple hundredths, we know something's up and it's likely tracking a spurious noise.
And we know that the frequency homing is the right move, because homing in on the fundamental and then following the harmonics (N * 120, N ≥ 2, N ∈ N) leads us right to the strong harmonics that we're looking for:
Here are the side-by-side graphs, homed tonal on the left, unhomed 120 Hz on the right (pay attention to the lower harmonics on the left side of each graph):
Harmonic Assessment
Total Harmonic Distortion
A metric that is used to determine the quality of the electricity is the total harmonic distortion, which is the ratio of the sum of the amplitudes of the harmonics to the fundamental.
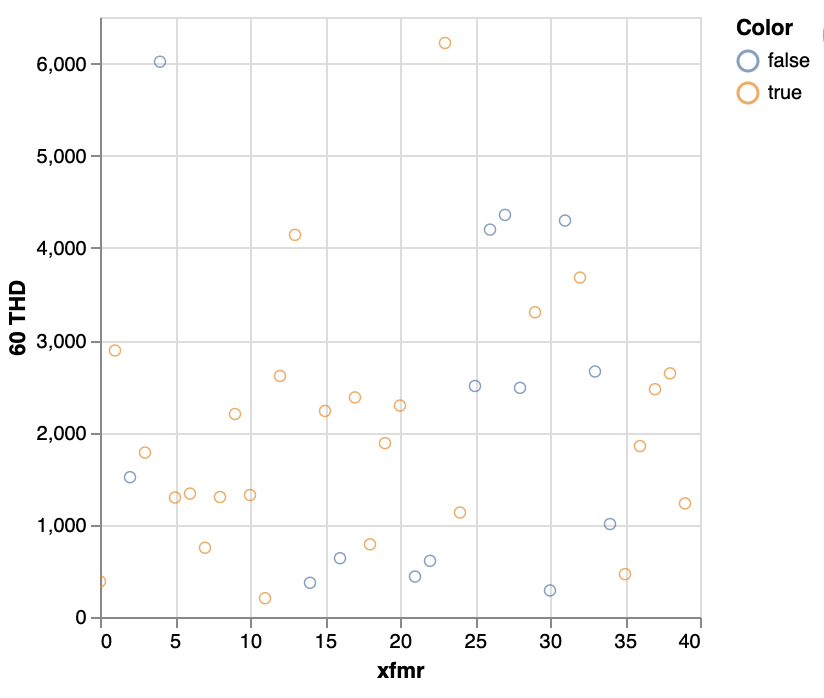
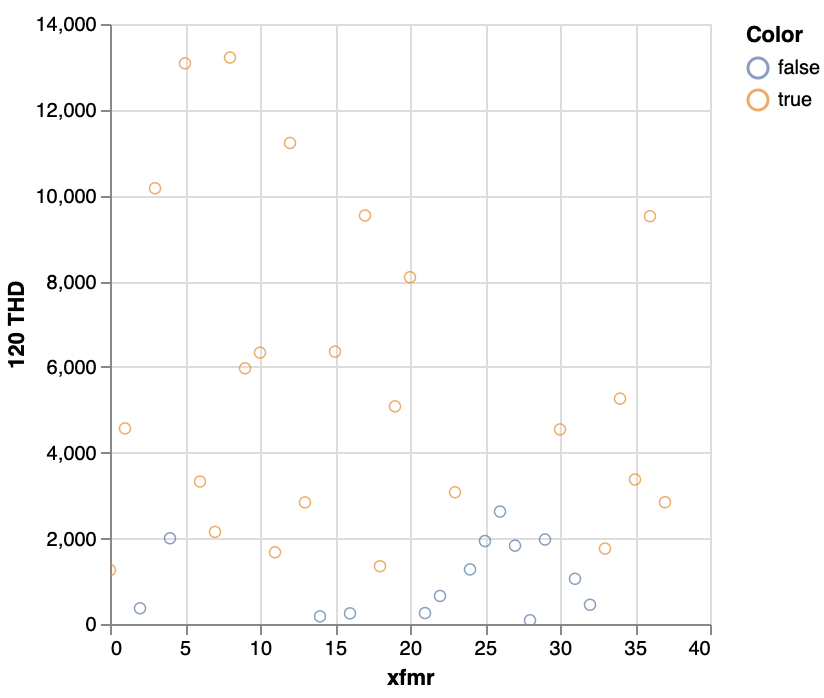
60 Hz THD is on the left, showing that there is a random mix of the transformers with the not-transformers. This shows that there isn't any consistent pattern of 60 Hz tones. On the right, there is the 120 Hz THD metric (zoomed in to better show the region where transformers might be misidentified by 120 Hz THD alone). It's pretty good, but not perfect, at splitting the two groups.
Harmonics
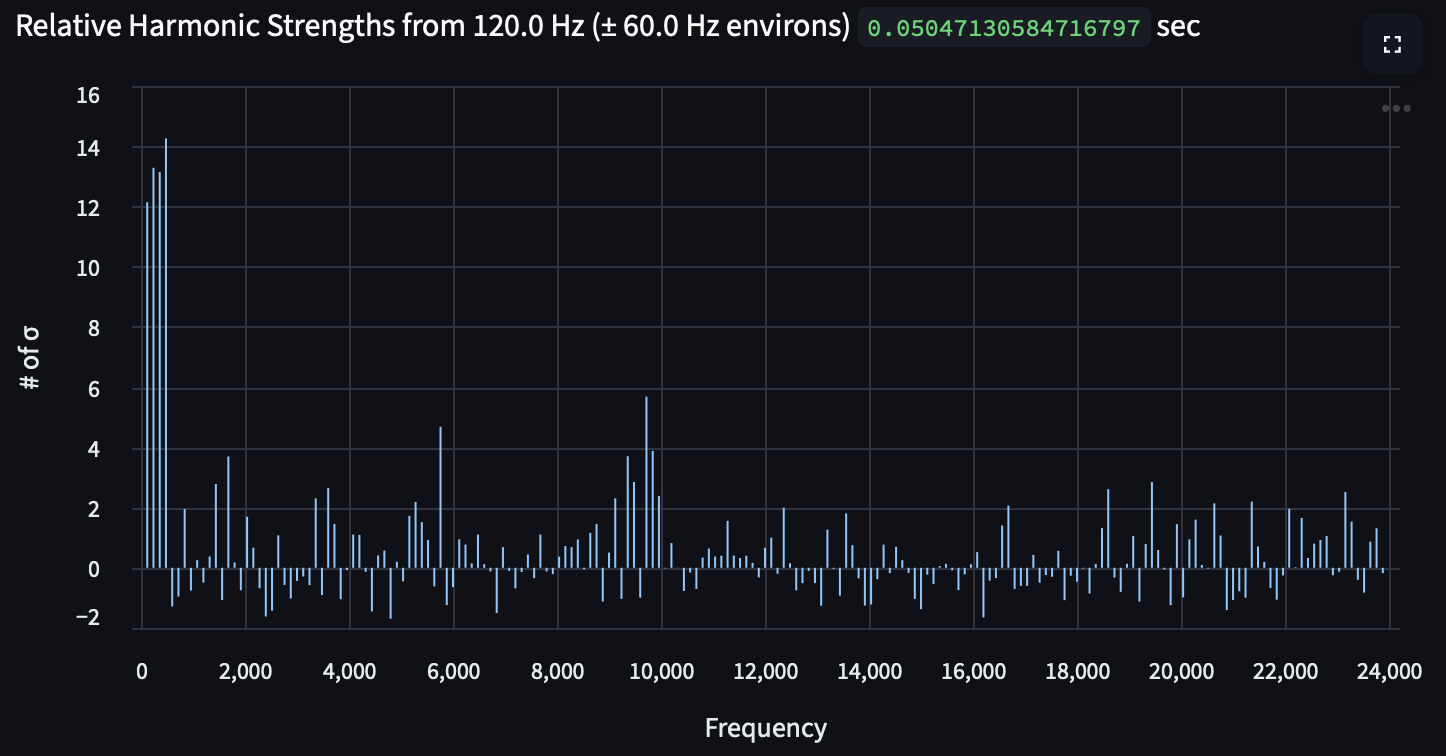
While the presence of a 120 ± 0.3 Hz tone is the primary indicator of a transformer, a crucial accompanying marker is the presence of the harmonics, which generally die off after the first ~5. Below is the transformer at 15th and R St NW; you can see the good, strong harmonics from the 1st (fundamental) to the 4th, after which it dies down to random noise for a bit. The harmonics around 8-10 kHz are interesting, but more research is needed before we can specify what they mean.
We therefore sum the harmonics and divide each harmonic by approximately the number harmonic it is (i.e. the number of standard deviations above the mean for the 4th harmonic is divided by approximately 4) — the goal is to favor lower harmonics so that we're not thrown off by the upper harmonics that are just random noise.
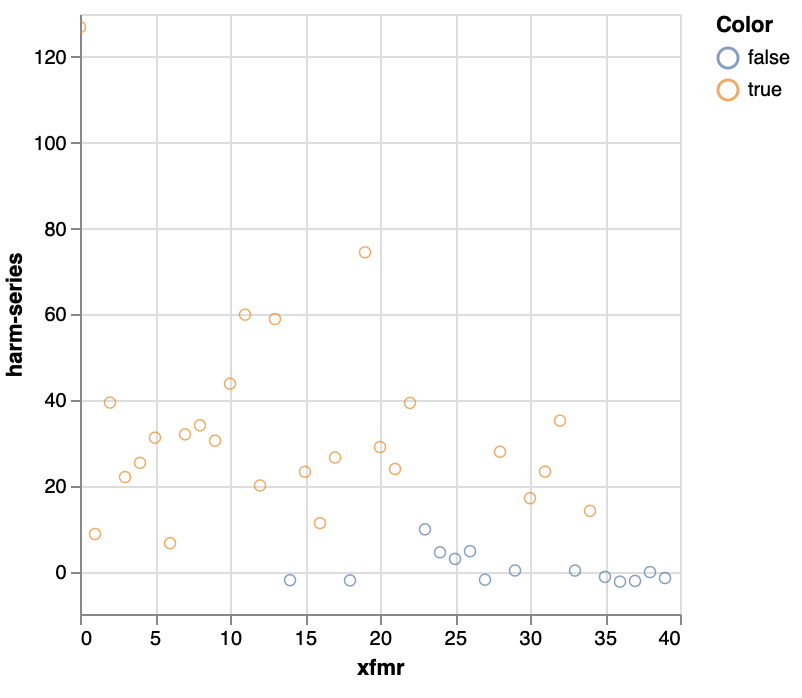
We have a pretty good distinction between the two classes (transformer and not-transformer), so this is something we can work with.
Combining Harmonics and Tonal Consistency
We want to favor proximity to 120 Hz, punish distance from it, and we want to favor lots of loud, strong harmonics. The actual combination of these characteristics into a formula is more political than anything, but the fundamental directions of these properties is not.
By zooming in on the border between the two classes, we can see that we still have decent class separation here with our new formula (slightly better than with just the harmonic series sum).
Best and Worst of Class
Now let's look at these strange outliers in our transformer class—
We'll start with the transformer at 10th and R St NW:
This is incredible, and it completely explains why our graph axes have been thrown off — this transformer is almost nothing but harmonics, which means its magnetic field is experiencing a lot of distortion, which is an extremely strong indicator that it is operating at or beyond its limits. This is exactly what we talk about in our project description! We assess this transformer to be extremely overloaded.
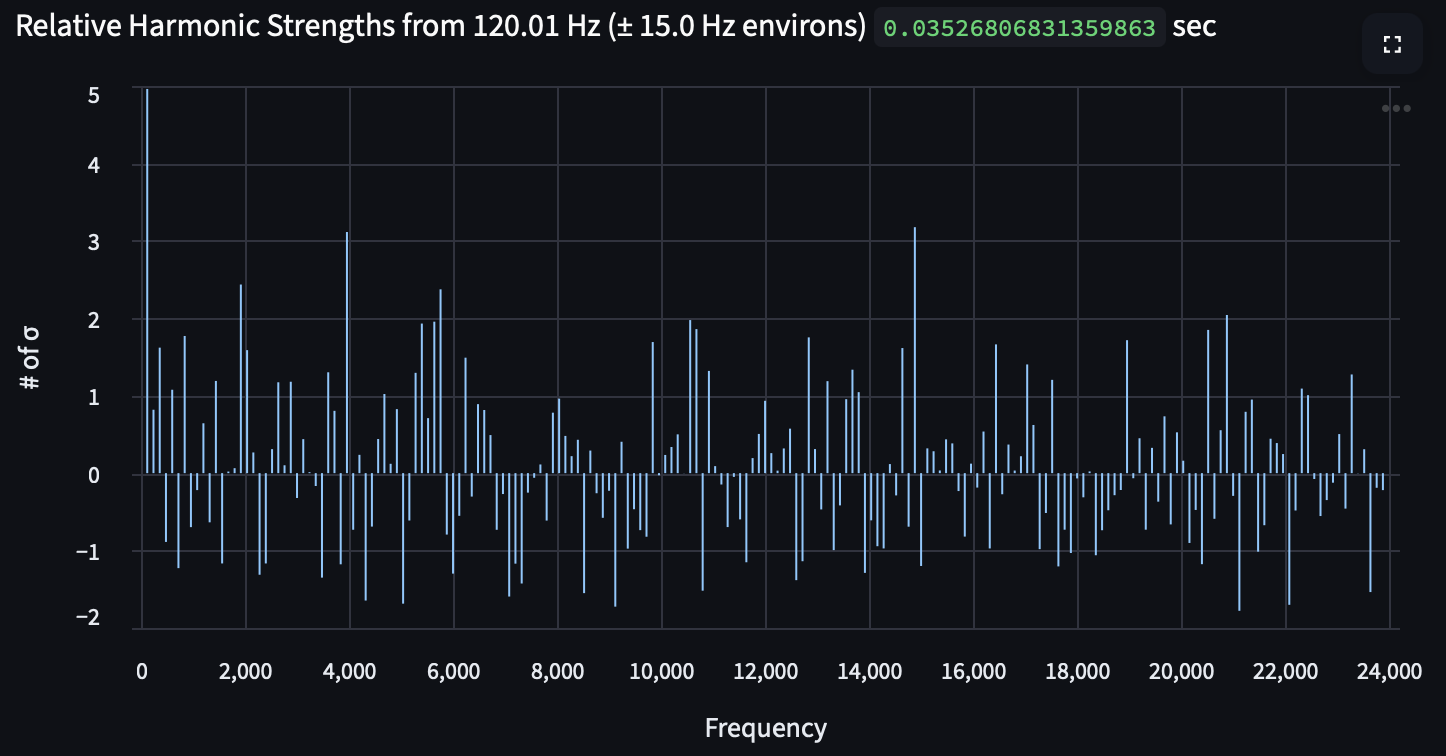
At 20th and R St NW, the transformer has a very strong 120.01 Hz, but both the fundamental and harmonics are hidden by the nearby noise (which is why the environs has to be reduced to a 30 Hz band). All of the harmonics are too low to be taken seriously, but given the strength and precision of the fundamental, we assess this transformer to be extremely underloaded.
Moving Forward
The next steps for assessment are to get recordings of more transformers at more consistent times (5-6pm and 3-4am). This will increase the likelihood that we will hear overloaded (5-6pm) and underloaded (3-4am) transformers.
Classifying Changes as Load Variation
Load variation can potentially be heard, but will require long-duration recordings.
Identifying and Correlating Unknown Tonals
In addition, this process has focused on extracting what we can from a single acoustic phenomenon; future work should identify unknown tonals that correlate with the known or deduced changes in the magnetic field (through the changes in the 120 Hz tonal).